See your board come alive
In this tutorial you will open Snakie's Board View and watch it draw a picture of your real board — then light up the exact pin your blink program uses. It is a fun, visual way to check your wiring at a glance.
What you need
The blink.py program from the previous tutorial, and your board plugged in over USB. If you skipped ahead, that program blinks the Pico's onboard LED.
from machine import Pin
import time

led = Pin("LED", Pin.OUT)

while True:
    led.value(1)
    time.sleep(0.5)
    led.value(0)
    time.sleep(0.5)
Open the Board View
The Board View lives in its own window that floats on top, so you can watch it while you edit.
- Make sure
blink.pyis open in the editor. - In the toolbar at the top, click the board button (the little picture of a circuit board, near the Run and Stop buttons).
- A new window opens and draws your board.
Tip
Board View reads your code as you type. Change your program and the drawing keeps up — no need to press Run.
Find the pin your code uses
Snakie scans your program for the parts of machine that talk to pins — things like Pin, PWM, I2C and SPI — and highlights every pad your code touches. (A pad is one of the metal points along the edge of the board.)
Because your blink program uses the onboard LED, look for the highlighted LED pin. That glowing pad is proof your code and your board agree with each other.
Explore the node graph
The window opens on the Node graph tab. A node graph is a tidy map of connections: each pin your code uses gets a line out to a little badge that names it.
- Every connection is shown by type — input, output, PWM, I2C, SPI, PIO or ADC — so you can see what each pin is doing.
- The Node graph is the only view that shows live values, so a running pin updates in front of you.
- Below the drawing, a PINS IN USE table lists the same pins as text.
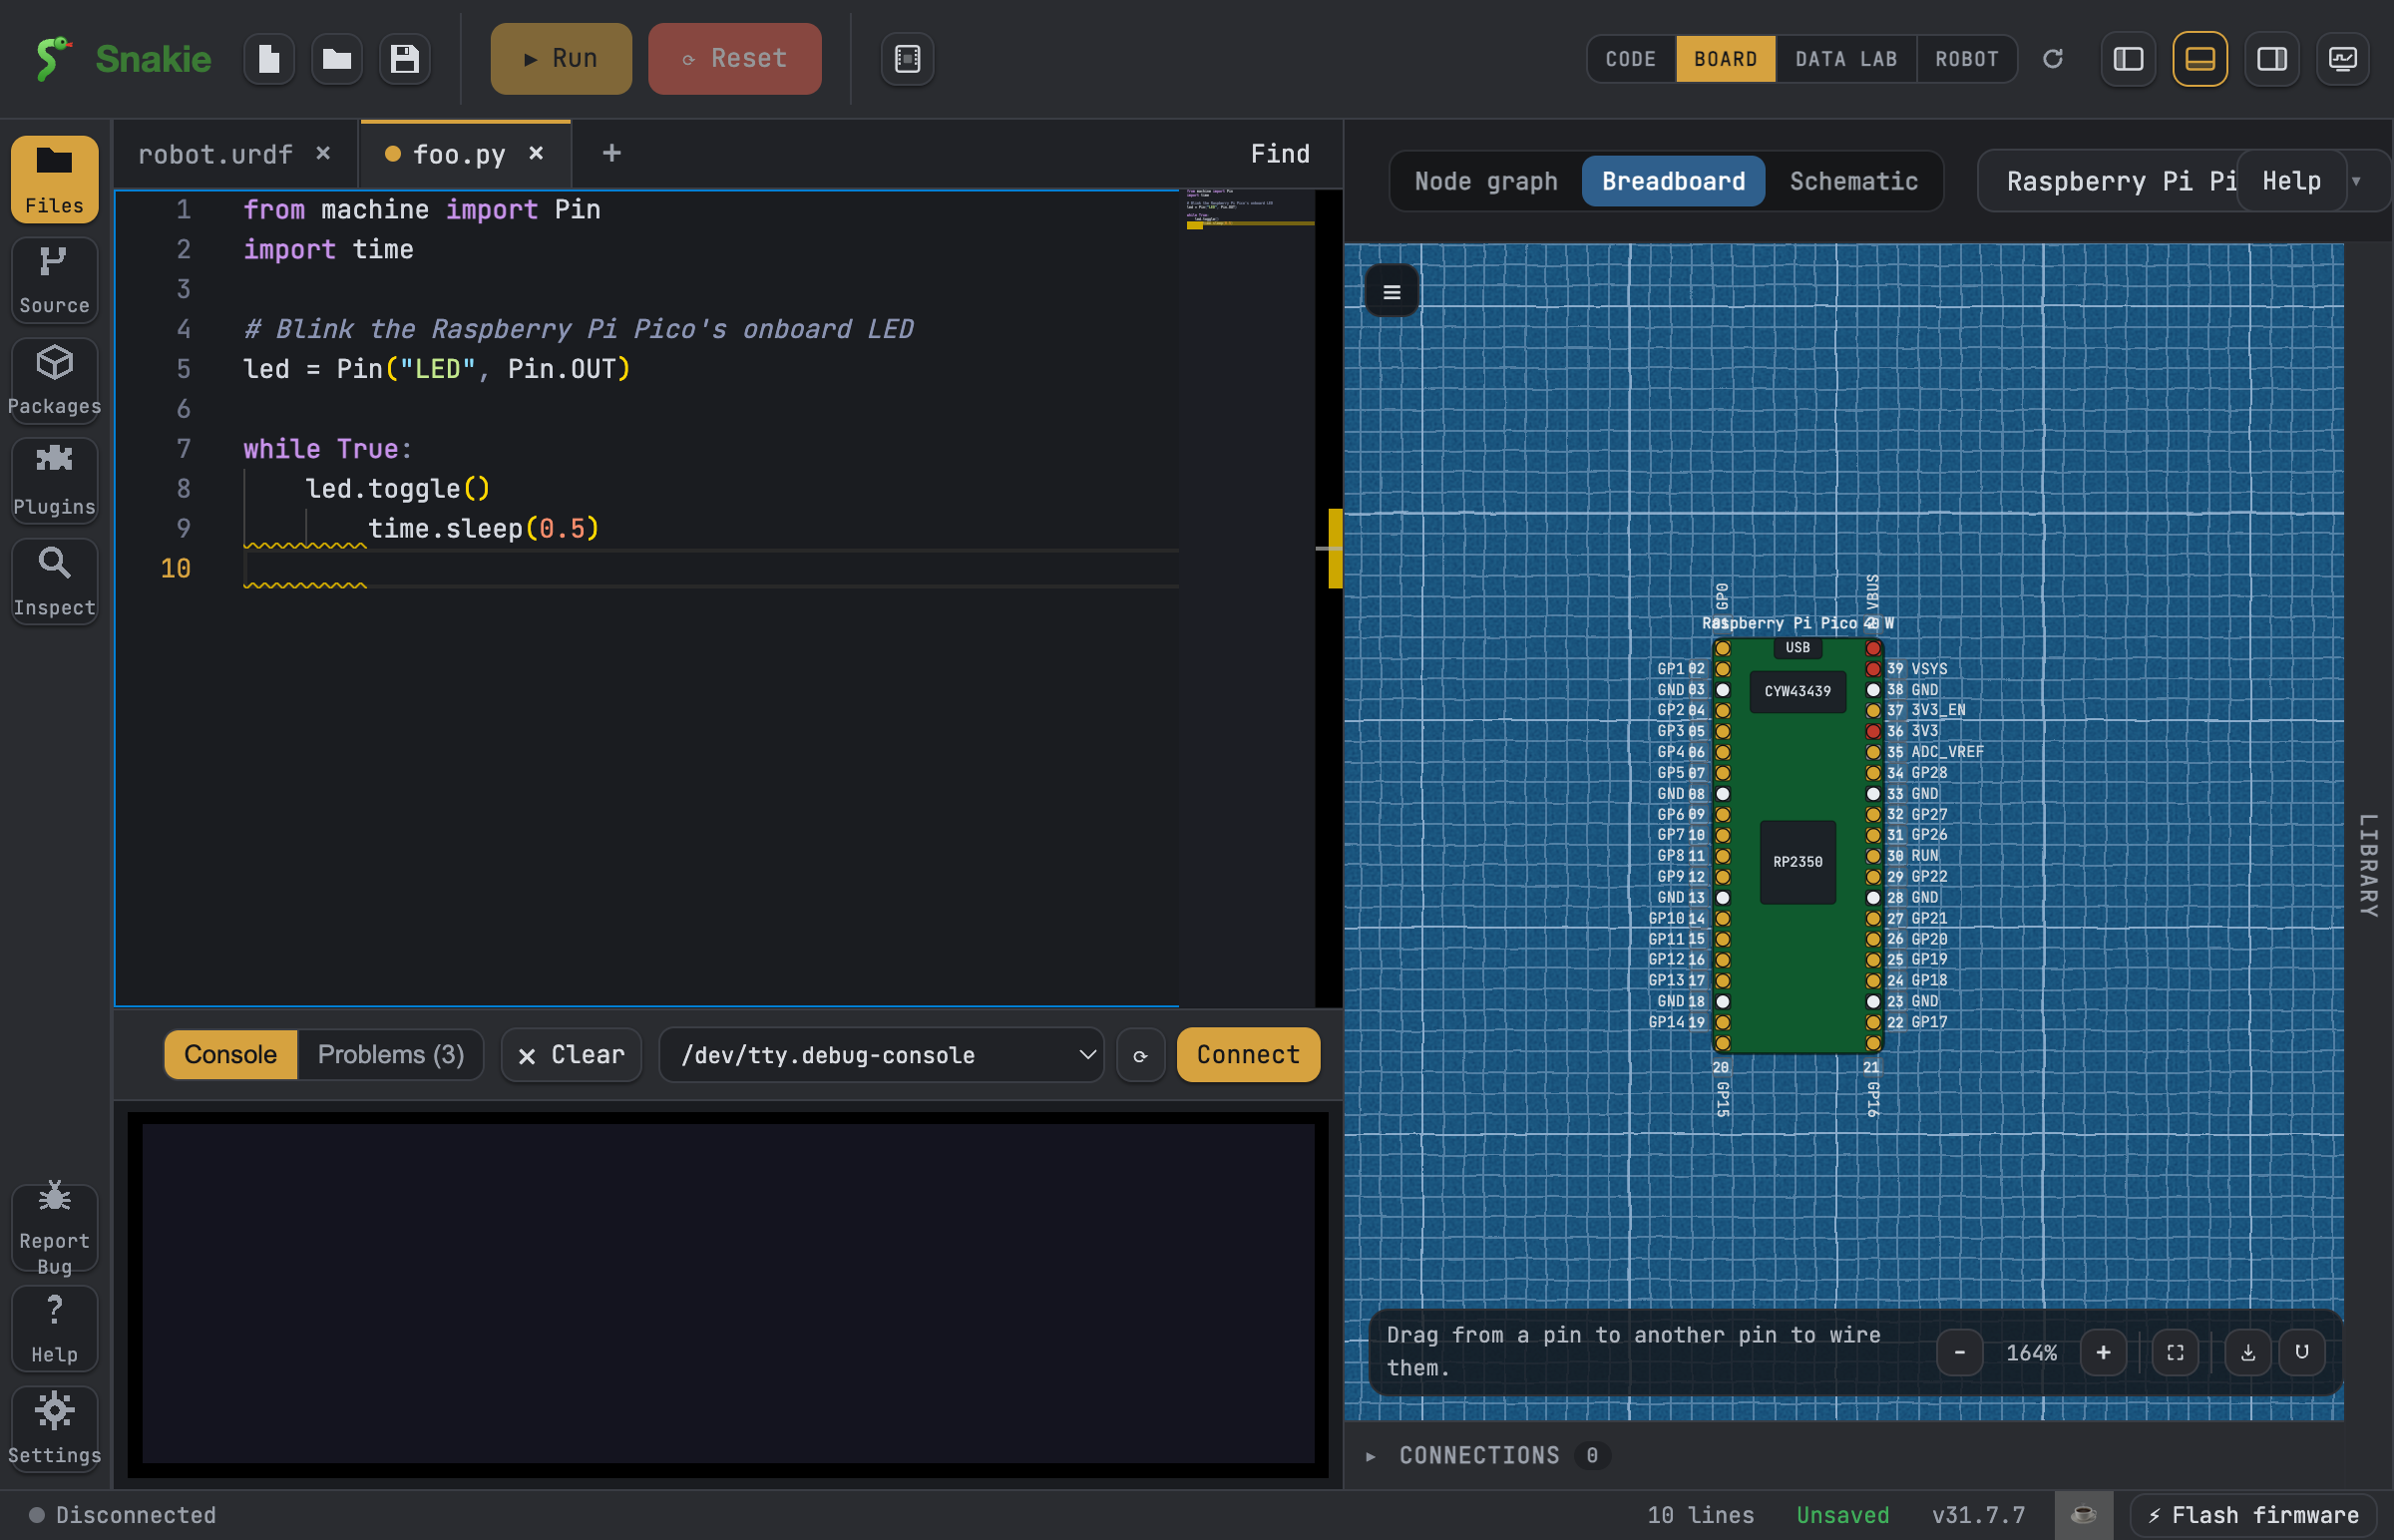
There are two more tabs to peek at later: Breadboard (a life-like board you wire by hand) and Schematic (a neat wiring diagram).
Zoom, fit and rotate
Find the floating cluster of buttons over the drawing and try them out:
- Click + and − to zoom in and out.
- Click the zoom-to-fit button to frame the whole board again.
- Click the rotate button to turn the board 90°, handy when your board is tall and thin.
- You can also export the picture as an SVG, PNG or PDF to share or print.
📸 Screenshot
Show: the node graph with the LED pin highlighted and the zoom/rotate controls visible.
What you learned
You opened the Board View, spotted the exact pin your blink program uses, explored the node graph of connections, and zoomed and rotated the drawing.
- Want the full tour of every button and tab? See the Board View how-to guide.
- Curious how Snakie figures out your wiring from your code? Read How Board View works.
Next up
Ready to see real numbers move? Continue to Plot a sensor and watch live data draw itself on a graph.